Documentation
Search your tandem mass spectra against public libraries and read the hits.
Overview
DreaMS Search compares the tandem mass spectra (MS/MS) you upload with large libraries of public reference spectra and ranks the hits. The DreaMS model judges likeness from the whole spectrum, so hits include related compounds as well as exact repeats of your measurement.
DreaMS is also the name of the model behind this site. This page documents the site's three tools: the search, the spectrum viewer and the DreaMS Atlas.
| Name | What it is | Use it when |
|---|---|---|
| DreaMS | The model and its Python package (source, paper). | You want embeddings in your own code, or to train on your own data. |
| DreaMS Search | The search application on this site. It runs the model over the libraries it serves. | You have a file and want hits for its spectra. |
| Spectrum viewer | A tool in this application that draws spectra from your files and scores two of them against each other. | You want to look at two spectra and compare them. |
| DreaMS Atlas | A map of public spectra and how they relate. It is built once from reference data. | You want to explore public spectra, with or without a file of your own. |
Your first search
Search one example file against one library and read the top hit.
- Open the search page.
- Pick an example. Examples run like an upload, against the same libraries. A single reference standard shows what a clear hit looks like.
- Choose a library. Its reference spectra come with known structures, so a hit can name your compound. Pick an annotated library for this first search.
- Start the search. The page shows progress while the server works.
- Read the top row of the results table. It is the hit with the highest DreaMS similarity.
- Look at the mirror plot on that row. Your query spectrum points up and the reference spectrum points down. Peaks that line up are fragments both spectra share.
What you should see. For a reference standard, the top hit is the same compound and most peaks line up. A sample of your own may return related compounds, called analogs.
Next. Before you search your own file, read What your file needs. To understand each column, read Reading results.
DreaMS Search
Give the search page a file of tandem mass spectra and choose which libraries to search. You get a results table for each library and a CSV file of everything.
Running a search
1. Give it a file
Drop one file of tandem mass spectra, or click to browse. Your browser reads it first, so the page tells you how many spectra it holds before anything is sent.
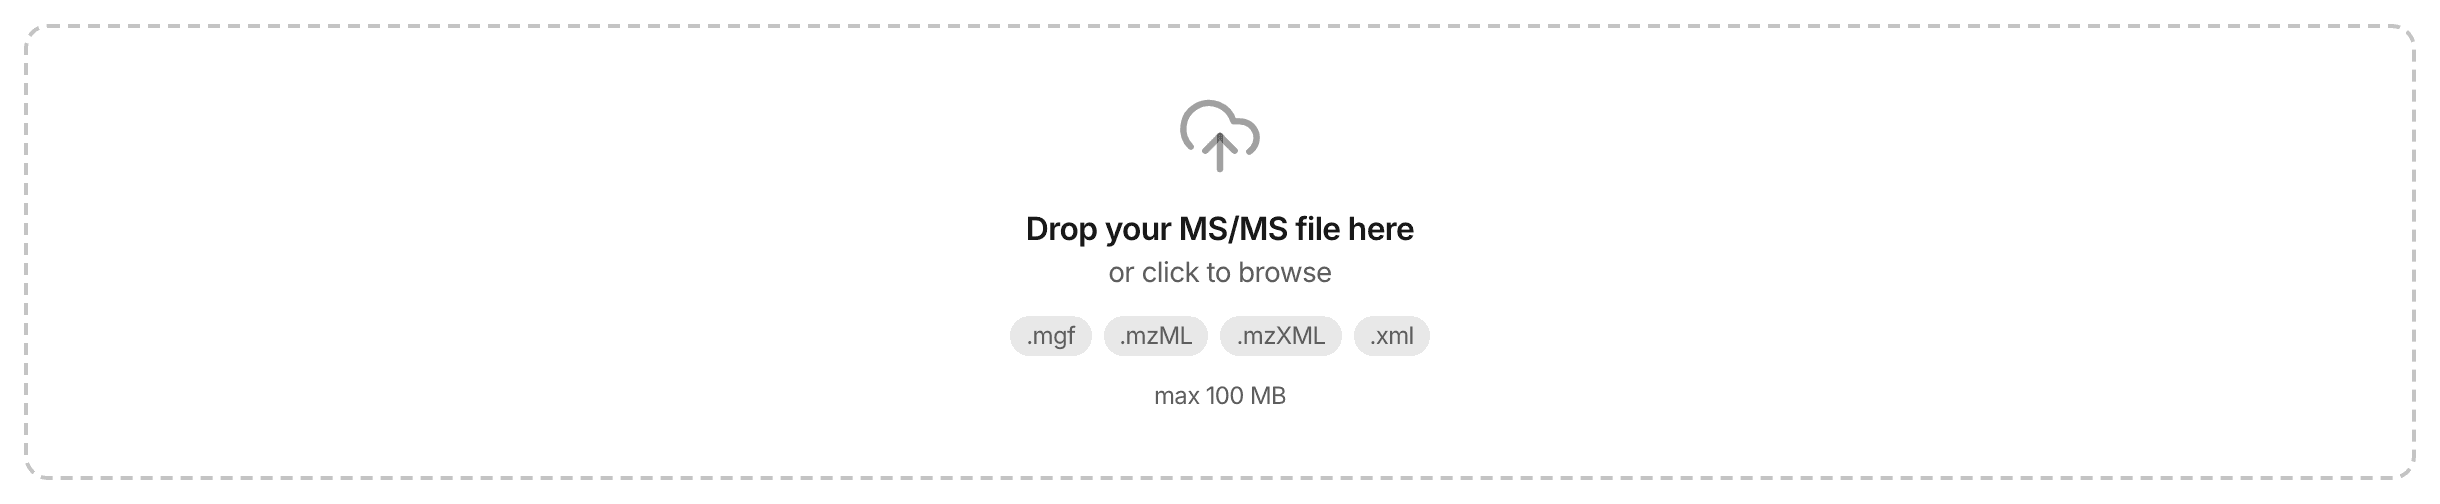
Pick an example if you have no file at hand. Examples run like an upload, against the same libraries.


2. Choose what to search against
Pick at least one library or dataset. Each one is ranked on its own and gets its own table, so you can always see where a hit came from. Pick several and you get several tables.
A library holds reference spectra, each linked to a molecular structure, so a hit can name its compound. A dataset holds spectra measured in public repository datasets. They carry no structure, so a hit points to similar measurements.


Loading the libraries…
Custom library
Attach a custom library of your own reference spectra alongside the file you are searching. The server reads and embeds it for that one search, holds it in memory while the search runs, and matches it exactly.
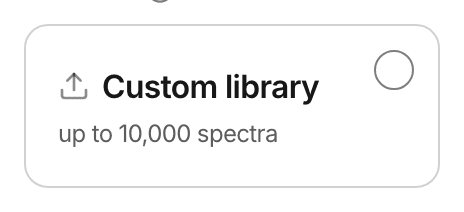
A custom library works as a search on its own, with or without a served library beside it.
3. Run it
The search runs on the server. Progress arrives live, and the page names the stage your file has reached.


After you submit, the search waits in a queue and the server reads your file. The progress percentage starts moving once the server searches the first part of your file.


What your file needs
Formats
One file per search. The extension decides whether the upload is accepted, so name a file for what it holds.
The search form lists the file formats this site accepts and refuses other files before the search starts.
Centroided MS/MS
Each peak should be one m/z value and one intensity, which is called centroided. The scores are built for that form. A profile-mode file is still searched, and the results count the spectra that declared profile mode.
To convert a profile file, run the msConvert peak picking filter before you upload it.
Positive ion mode
The model was trained on positive-mode spectra, so it works best there. Negative-mode spectra are searched too. The results state the count and mark the rows, so you can weigh those rankings. The ion mode comes from your file, and it stays unknown when the file declares none.
Current limits
These limits apply on this site. The size limit counts the uncompressed file. If your file exceeds a limit, the search form tells you which one.
Loading the current limits…
Reading results
Each library gets its own results table, ranked by DreaMS similarity. Compare scores inside one library, because the size of a collection and the way it was built differ between libraries.
Pick a query spectrum
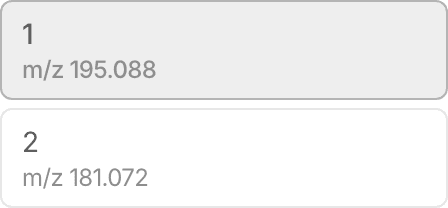
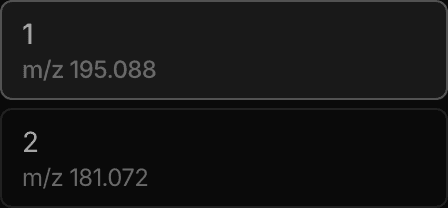
A query spectrum is one spectrum from your file. The panel beside the results table lists the query spectra that produced hits, each with its precursor m/z and best score. Open the highest scores first.
The results table
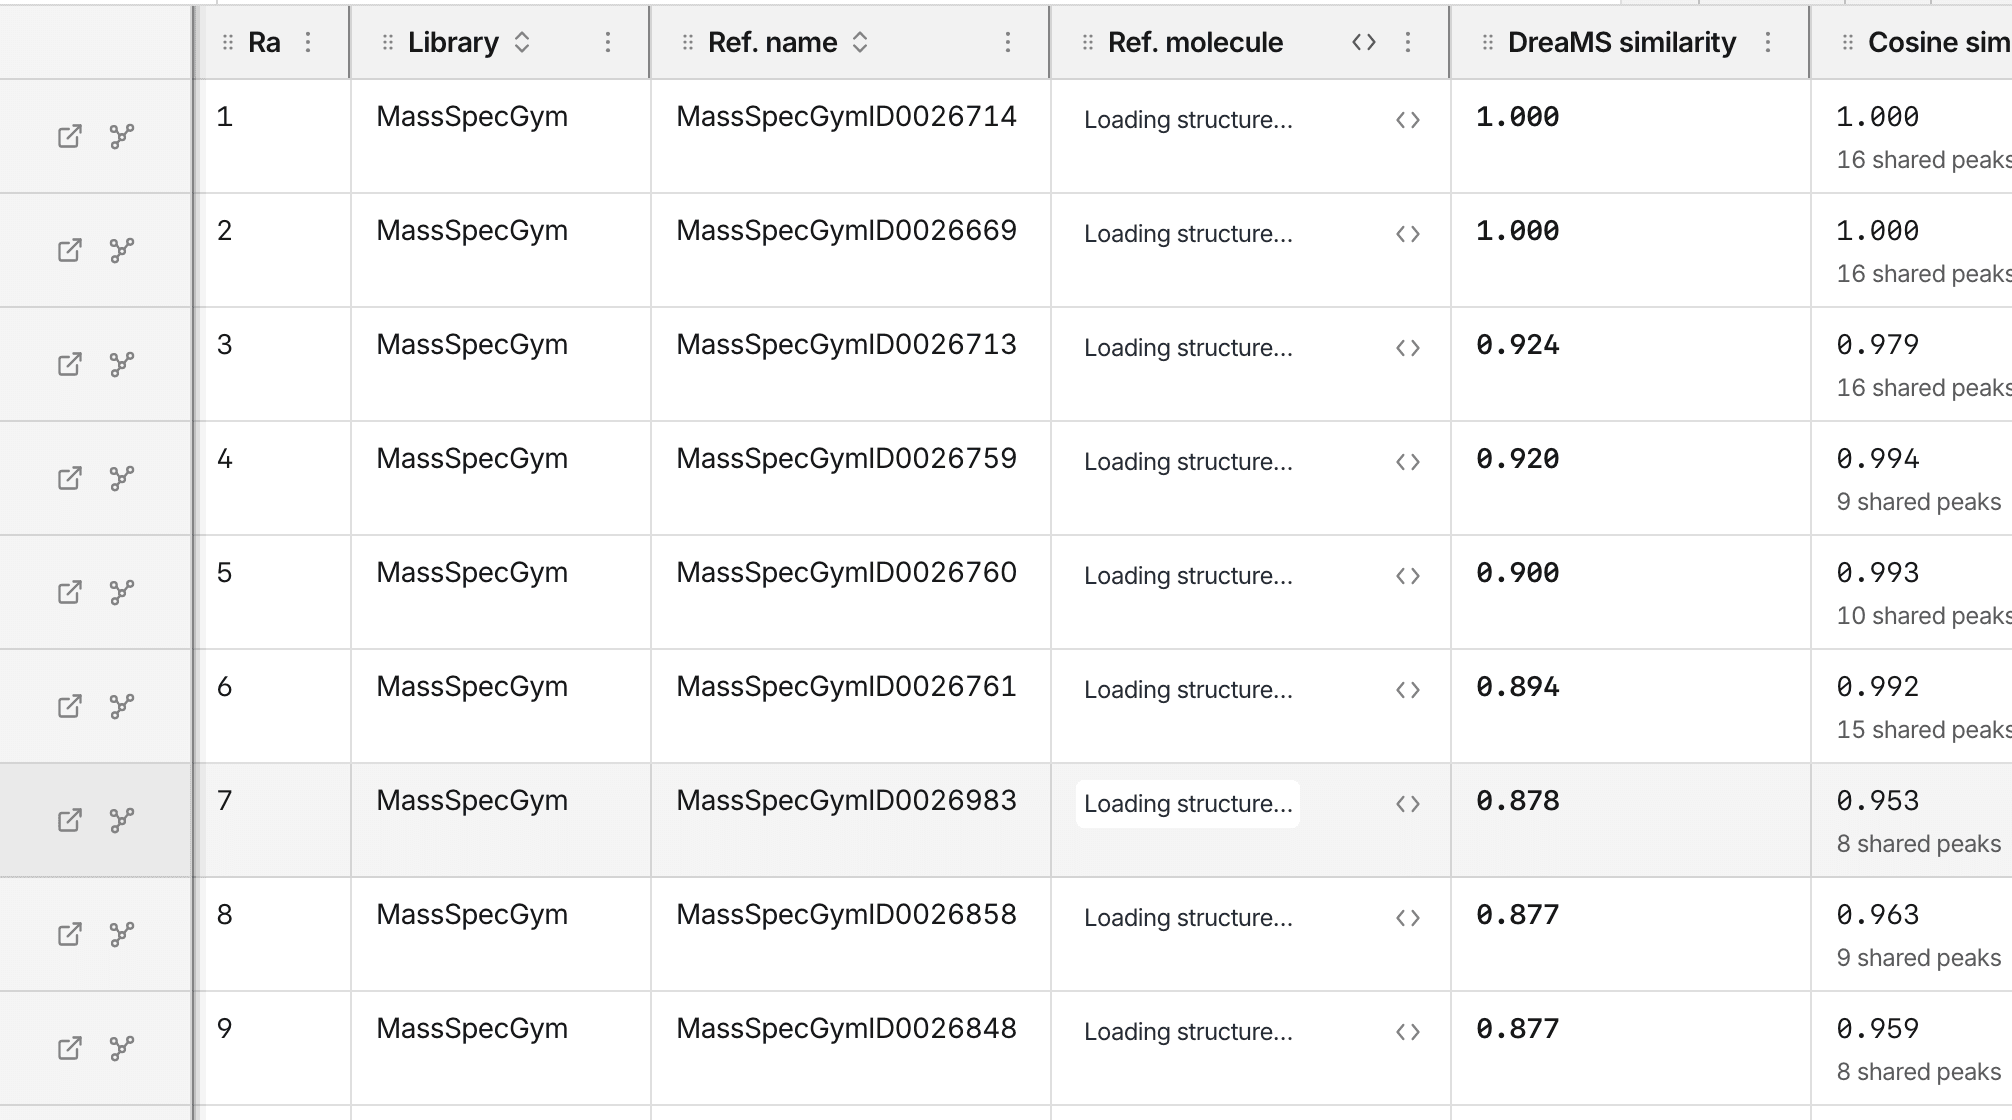
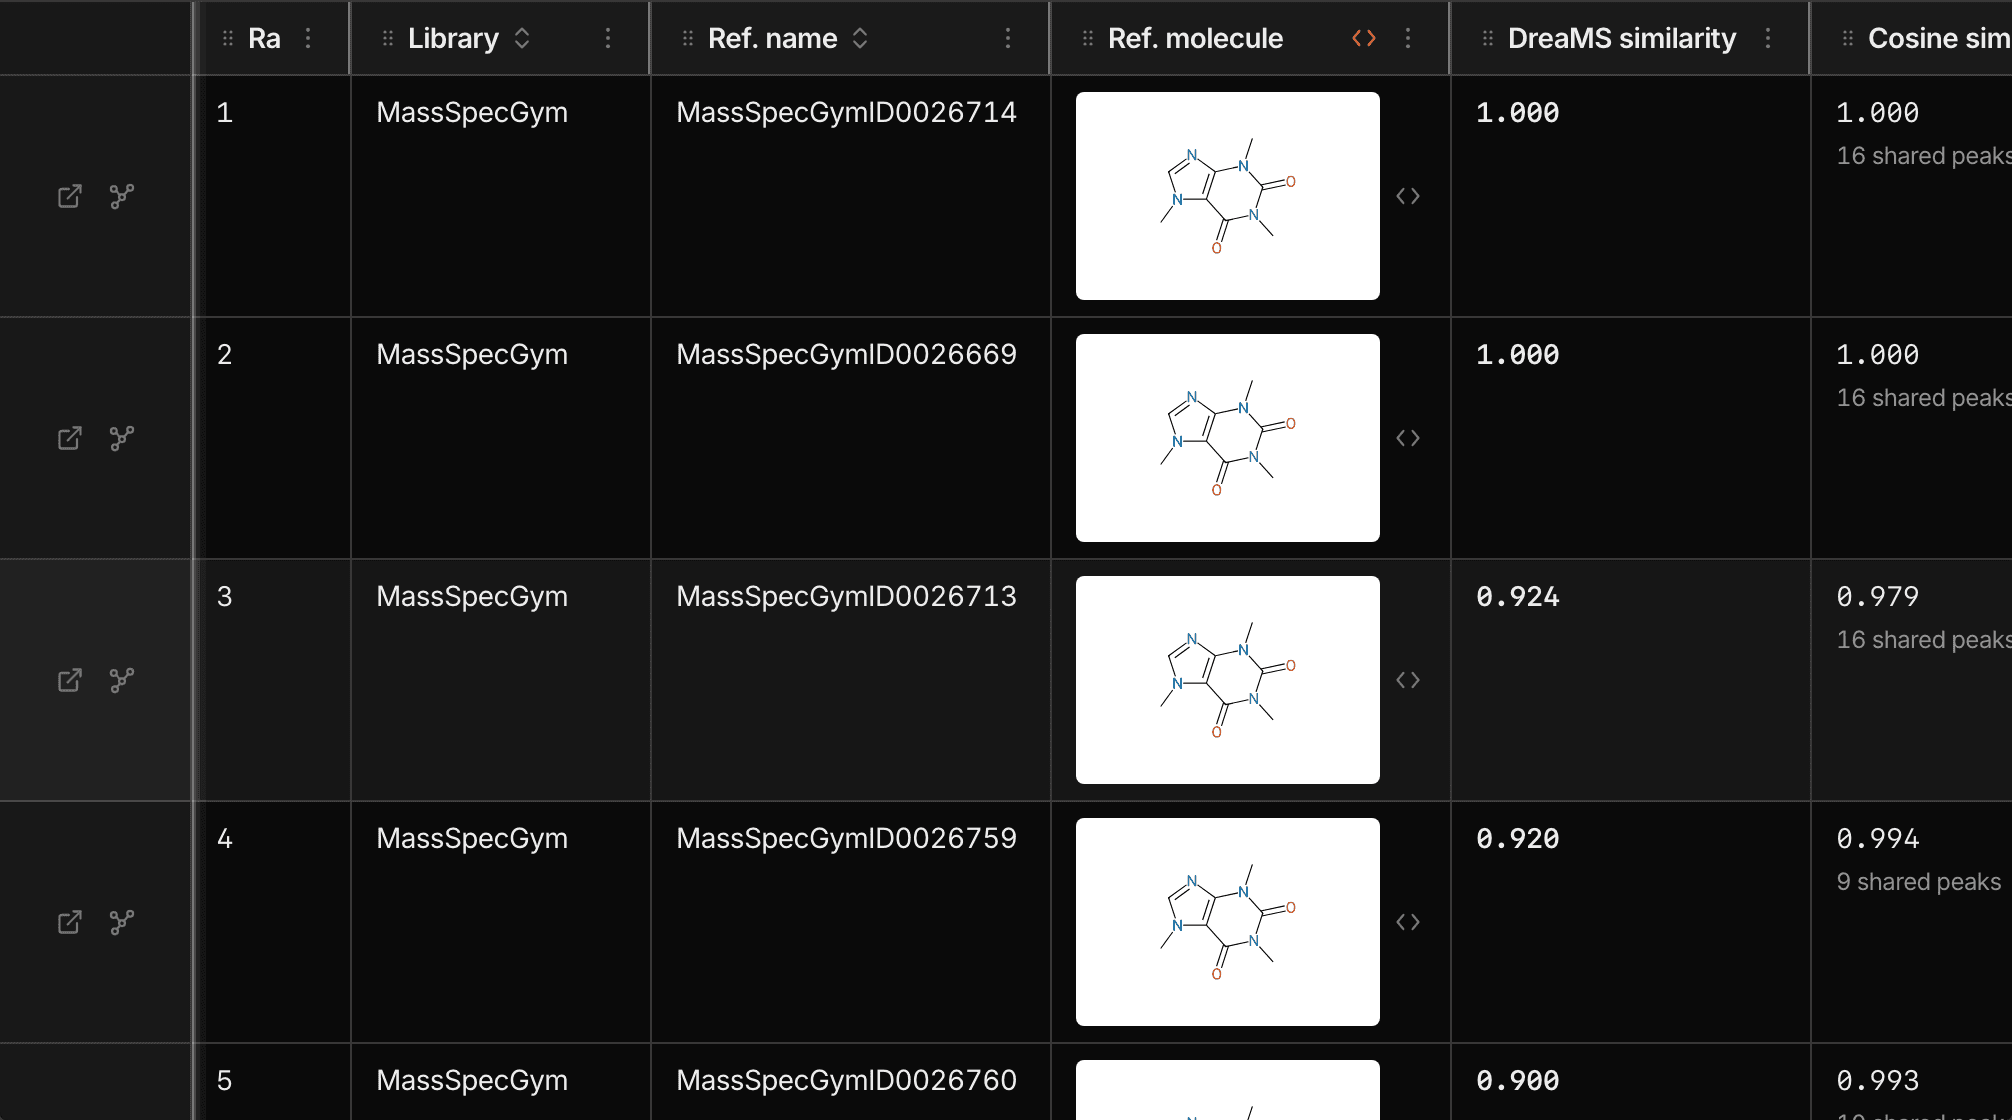
The results table has one row per hit. A column appears once some row fills it, so richly annotated hits bring more columns.
Read a hit in three checks
- Does the structure make sense for your sample?
- Do the peaks line up in the mirror plot?
- Do several scores agree?
The five scores
Every hit carries five scores. They answer different questions, so a hit that scores well on several is stronger than a hit that scores well on one.
| Score | Question it answers | Higher means | Filled when |
|---|---|---|---|
| DreaMS similarity | Does the model find these spectra alike? | A closer match in the model's view | Always, for a served library |
| Cosine similarity | Do the fragment masses agree? | More shared peaks, weighted by intensity | The library has reference peaks |
| Modified cosine | Do they agree once a precursor m/z shift is allowed? | The same, across related compounds | The library has reference peaks |
| Precursor-loss cosine | Do both lose the same pieces from the precursor? | More similar losses | The library has reference peaks and both spectra have a precursor m/z |
| Entropy similarity | Do they agree on the peaks that carry the most information? | A closer match on informative peaks | The library has reference peaks |
Cosine, modified cosine and precursor-loss cosine each show a matched-peak count. A high score with two matched peaks rests on little evidence.
How much to trust the top hit
DreaMS similarity ranks hits. A high value says the model finds the spectra alike.
If your molecule is missing from the library, the top hit is an analog, and its score can still look high. Check the structure and the mirror plot before you use the name. Confirm an identity with a reference standard.
The mirror plot
Every row draws your query spectrum against the hit's reference spectrum, yours up and the reference down. Peaks that line up are fragments both spectra share, and a peak with no partner belongs to one spectrum only.
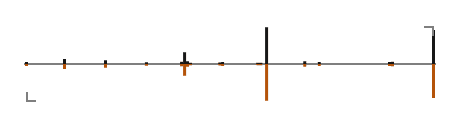
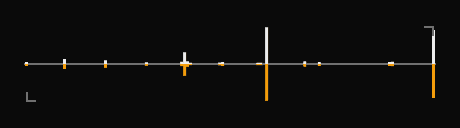
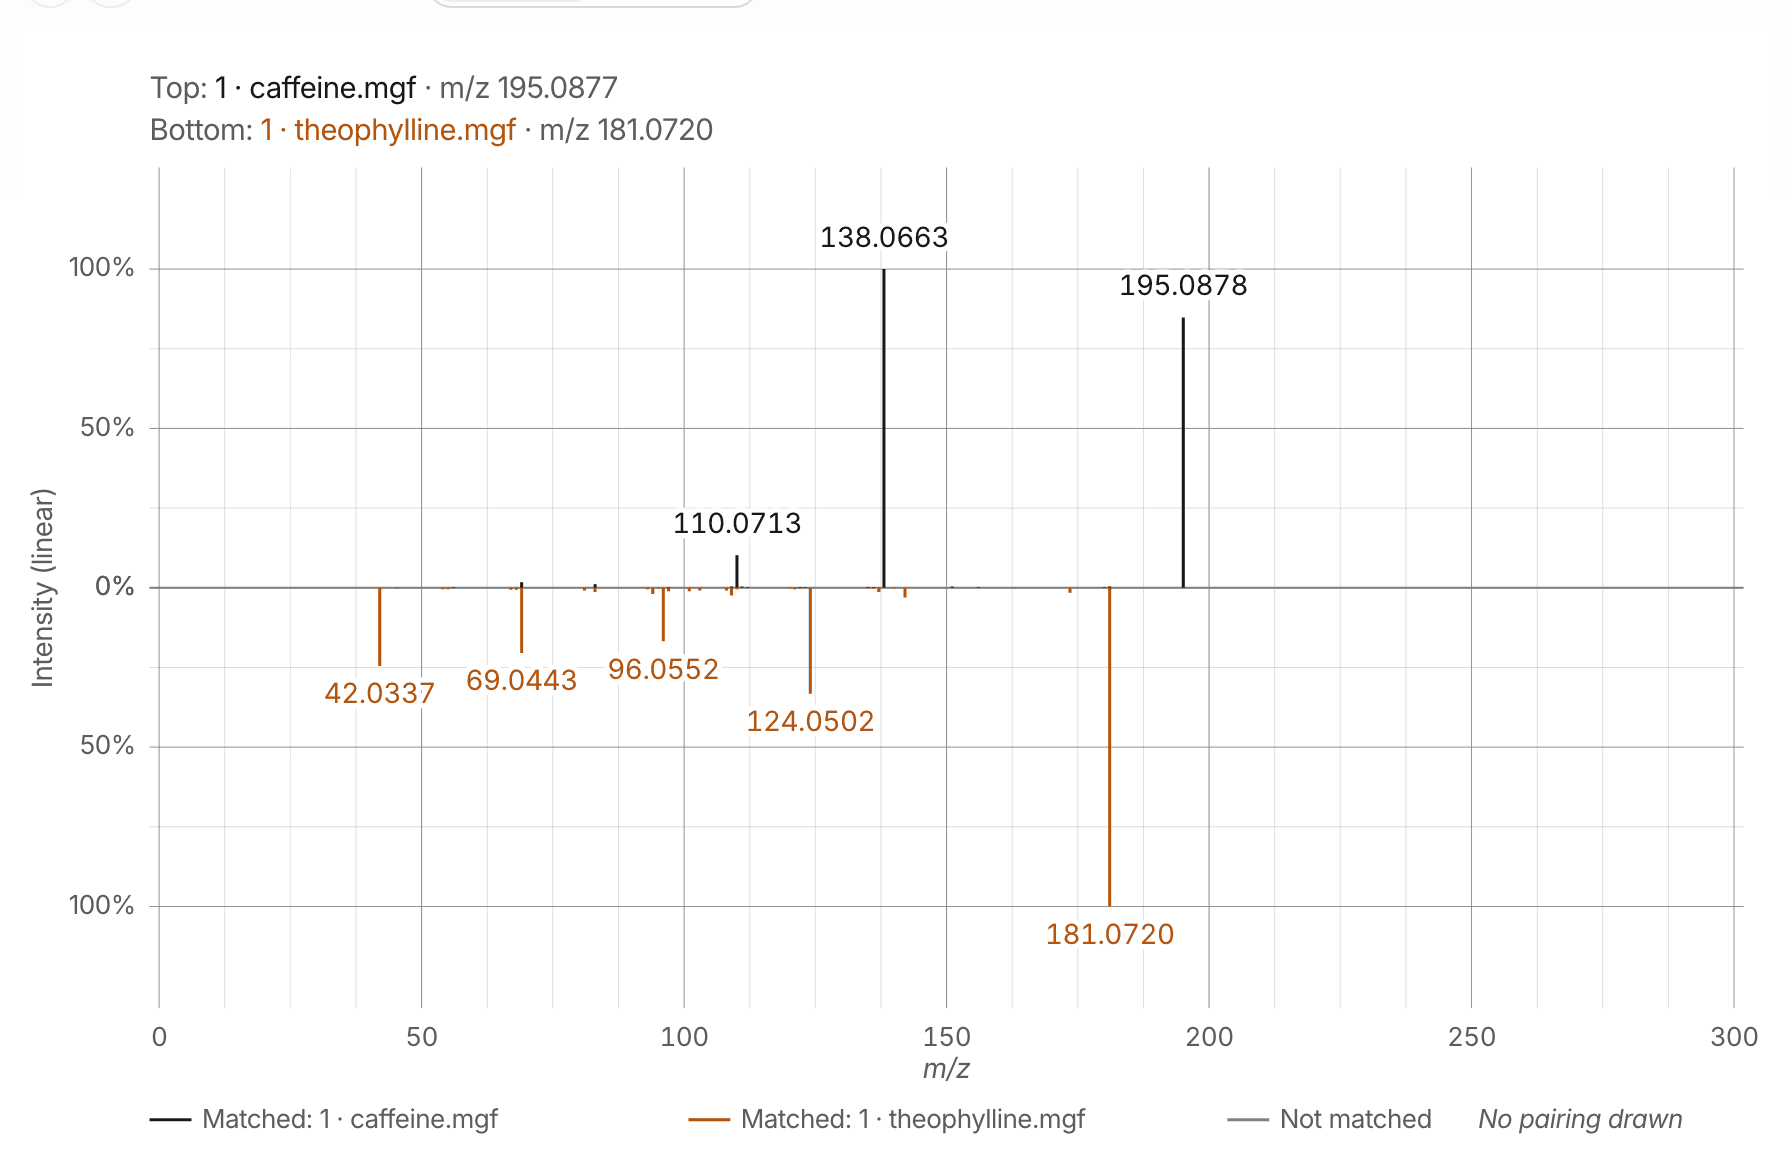
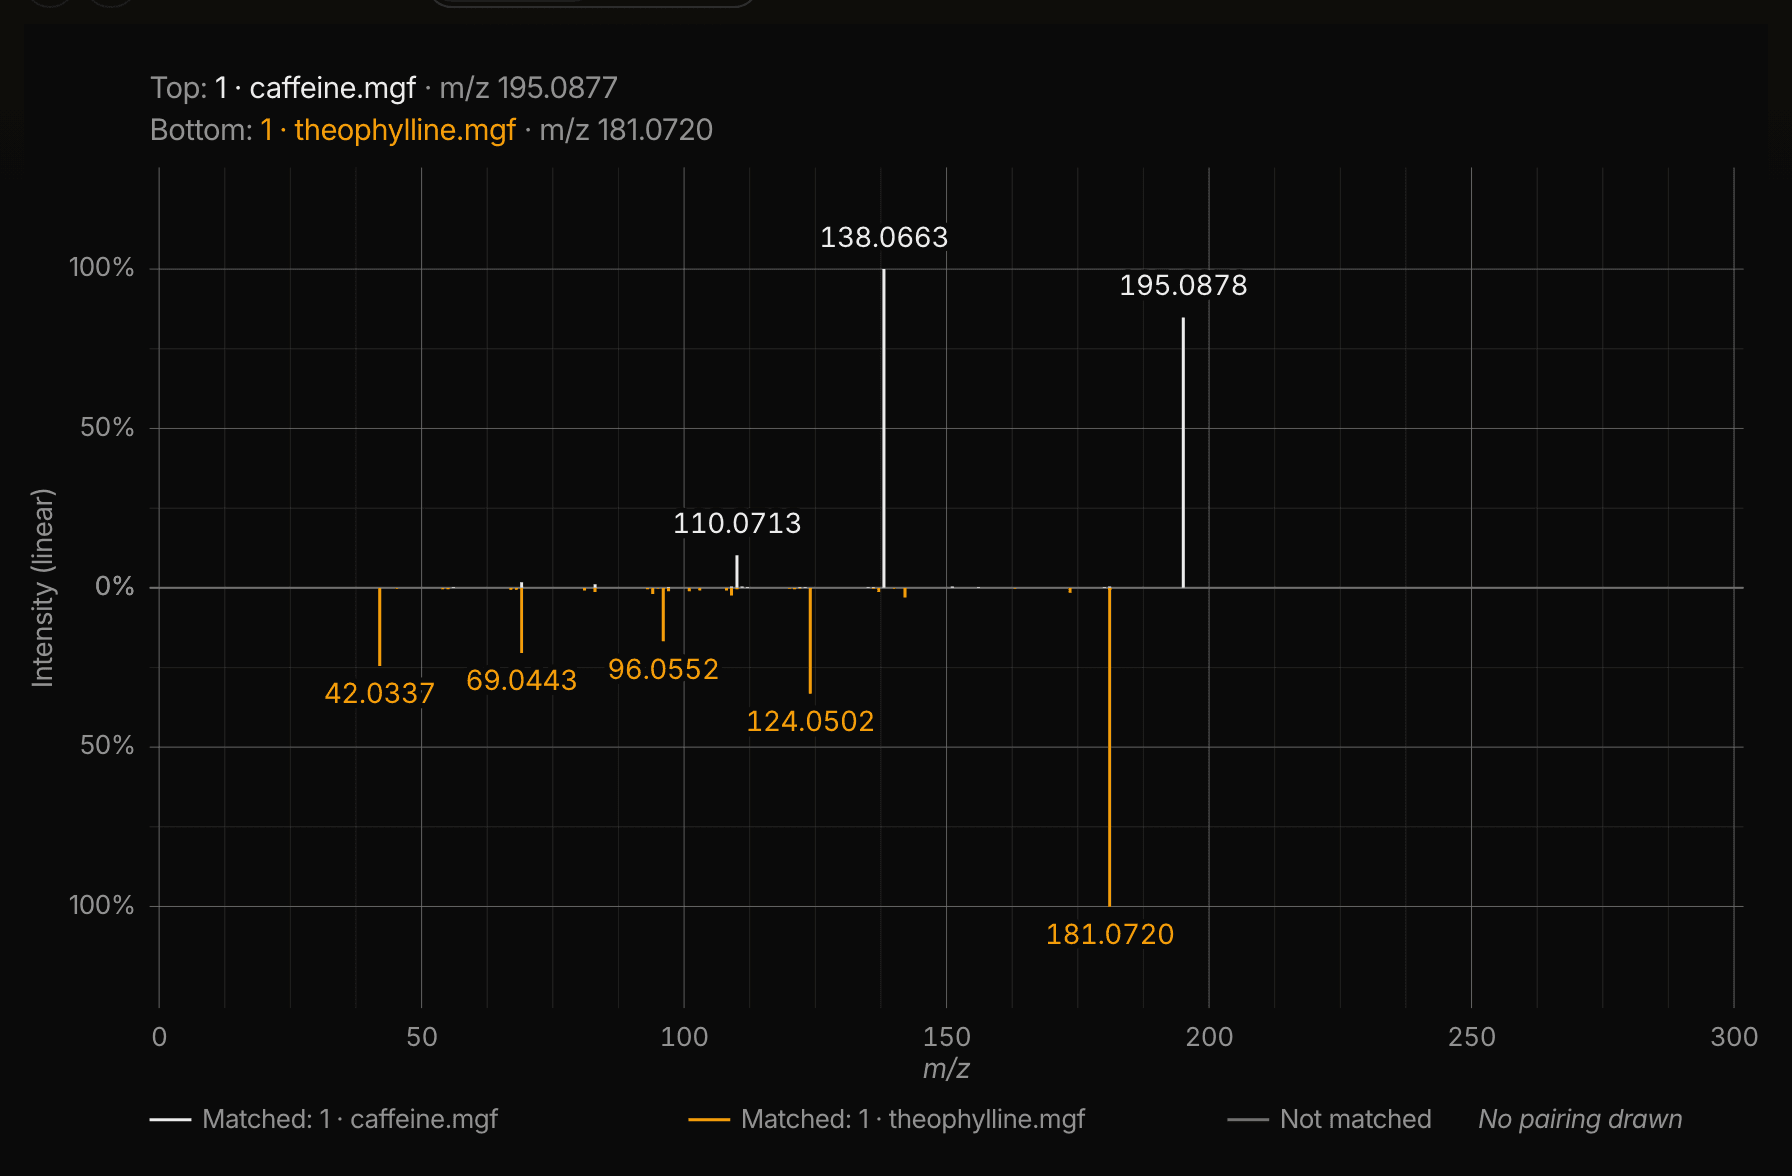
Below is the same plot at reading size, drawn by the same code, for two standards this application ships. Caffeine and theophylline differ by one methyl group, so their precursors sit 14.0157 apart and several fragments are shared. Modified cosine holds up across a precursor m/z shift, where plain cosine drops.
Narrow and export
Use the toolbar to filter rows, choose columns and download the CSV file. Filters narrow the hits of the open query spectrum.
- Type a word to search every column.
- Pick a column to compare it, such as DreaMS similarity ≥ 0.9 or Adduct is one of [M+H]+, [M+Na]+.
- Filters combine with AND. The Advanced filter adds OR across columns.
- A hit missing the value you filtered on is left out, so a library without that column shows no rows.


Limits and caveats
Quality filtering
The form can drop your low-quality spectra before the model sees them. It applies the quality criterion the DreaMS authors defined. It acts on your own spectra only, so the libraries stay as they are.


The filter starts off, so every spectrum is searched. The results state how many spectra it dropped. A file whose spectra are all dropped fails with a stated reason.
Input the model was trained for
| Input | What happens | Notice |
|---|---|---|
| Negative mode | Searched. The model trained on positive mode, so read these rankings with more caution. | A count above the table, a marker on each affected query spectrum. |
| Profile mode | Searched. Centroided peaks are what the scores are built for. | A count of the spectra that declare it. |
| Unknown mode | Searched, and recorded as unknown. | None. The file declares no mode. |
One library carries negative-mode references, and its hits are labeled on the row.
Fixed result depth
Every search returns the same number of hits for each query spectrum and library, and the CSV file holds all of them. The current limits list that number.
Approximate matching
Searching tens of millions of spectra uses an approximate method. The ranking comes very close to the exact answer and costs far less. A library you upload is small enough to match exactly.
Results expire
The server keeps a finished search and its download for a limited time, listed under the current limits. Recent searches lives in your browser and outlasts that time, so it can list a search whose result the server has deleted.
Spectrum viewer
Spectrum viewer opens one or two files and draws their spectra straight away. Your browser reads the files, so they stay on your machine and a spectrum appears as soon as you drop it in.
Comparing two spectra
Every spectrum in the list carries a Top and a Bottom button. Press Top on one and Bottom on another. The viewer draws them head to head and scores the pair on the same five columns the results table carries.
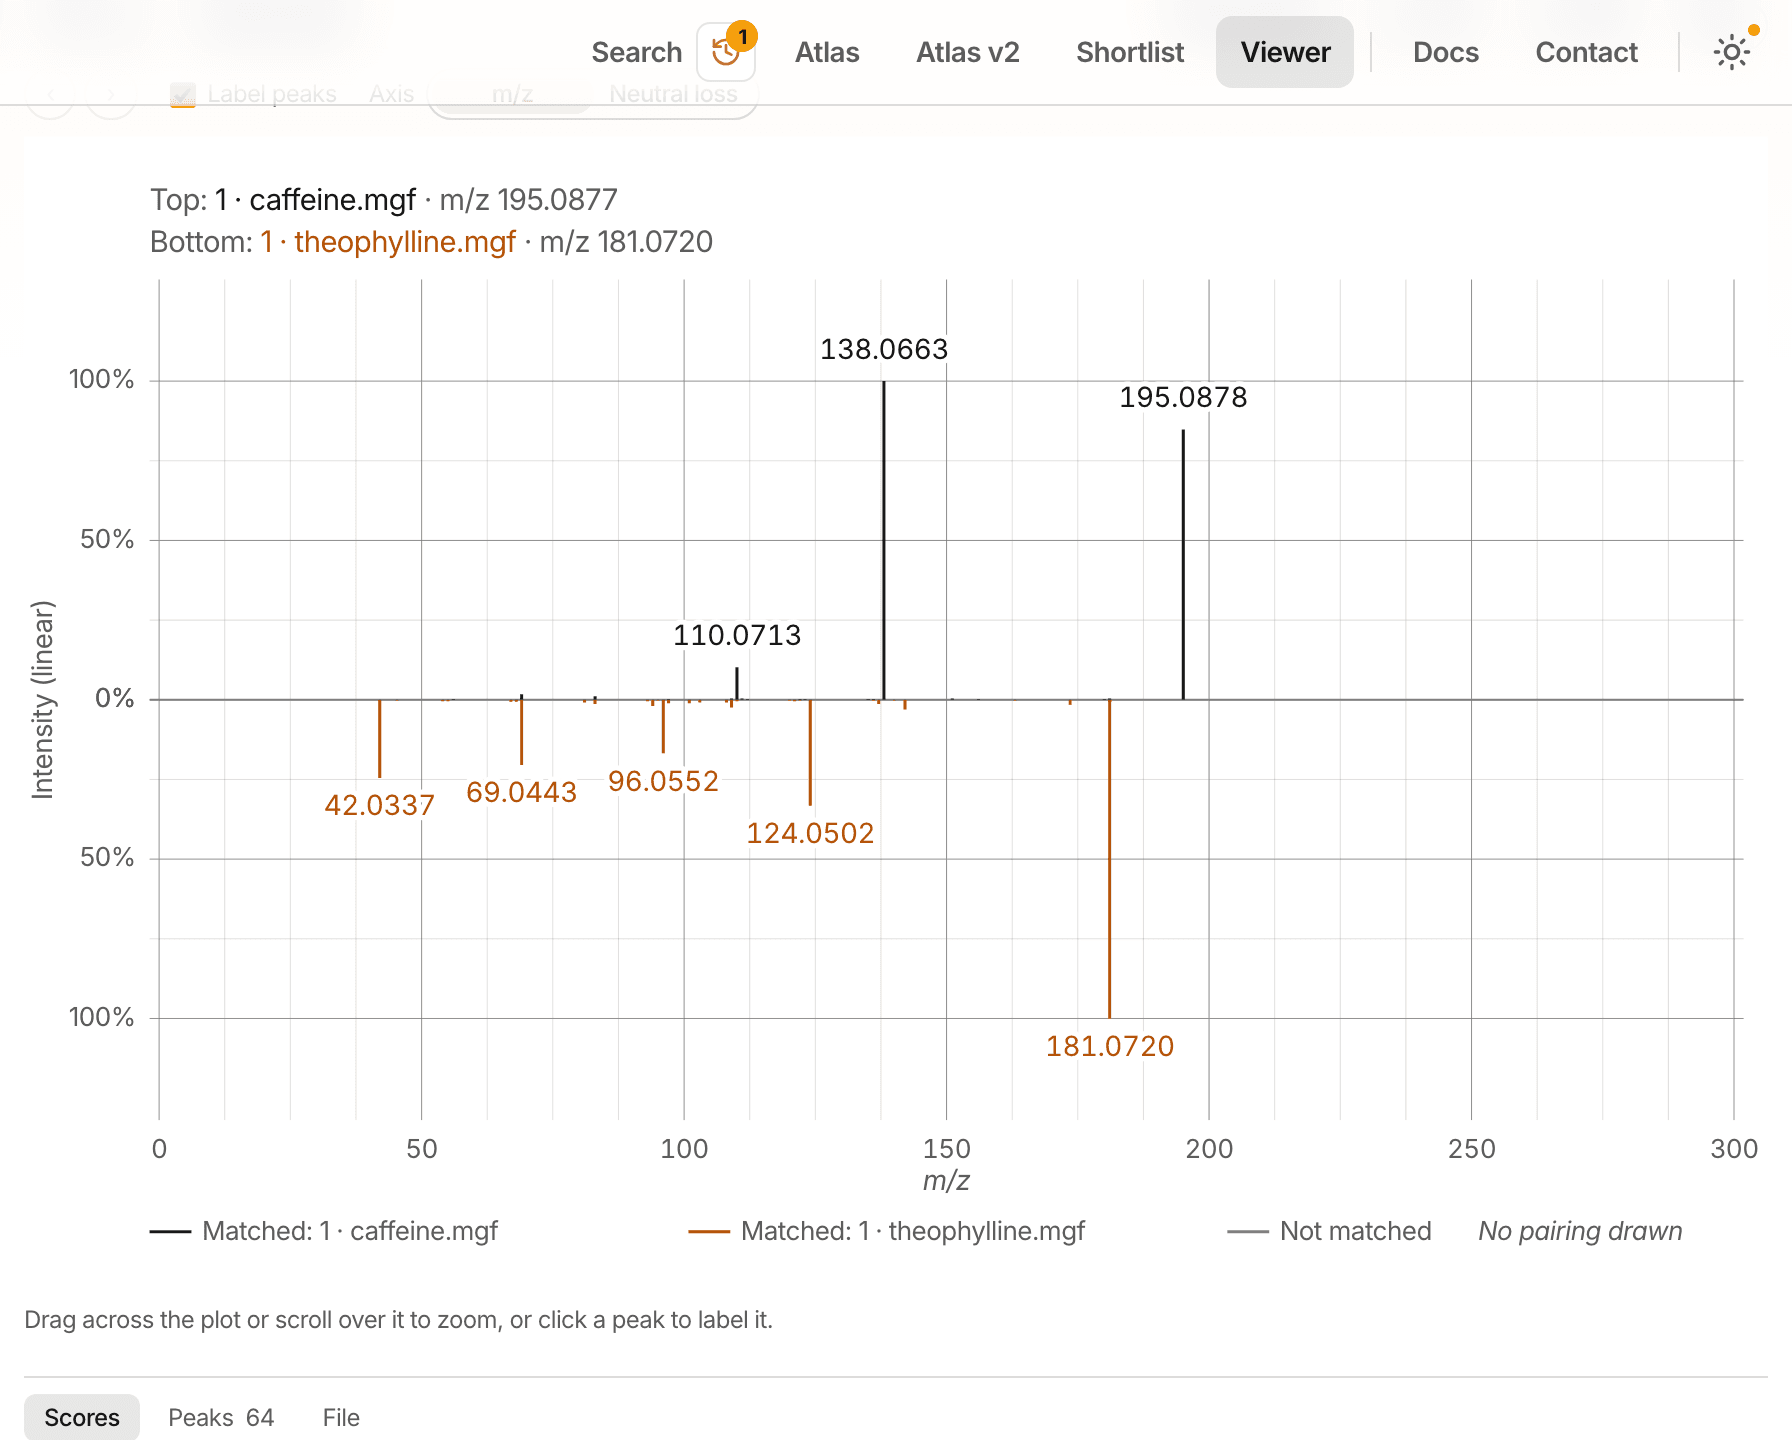
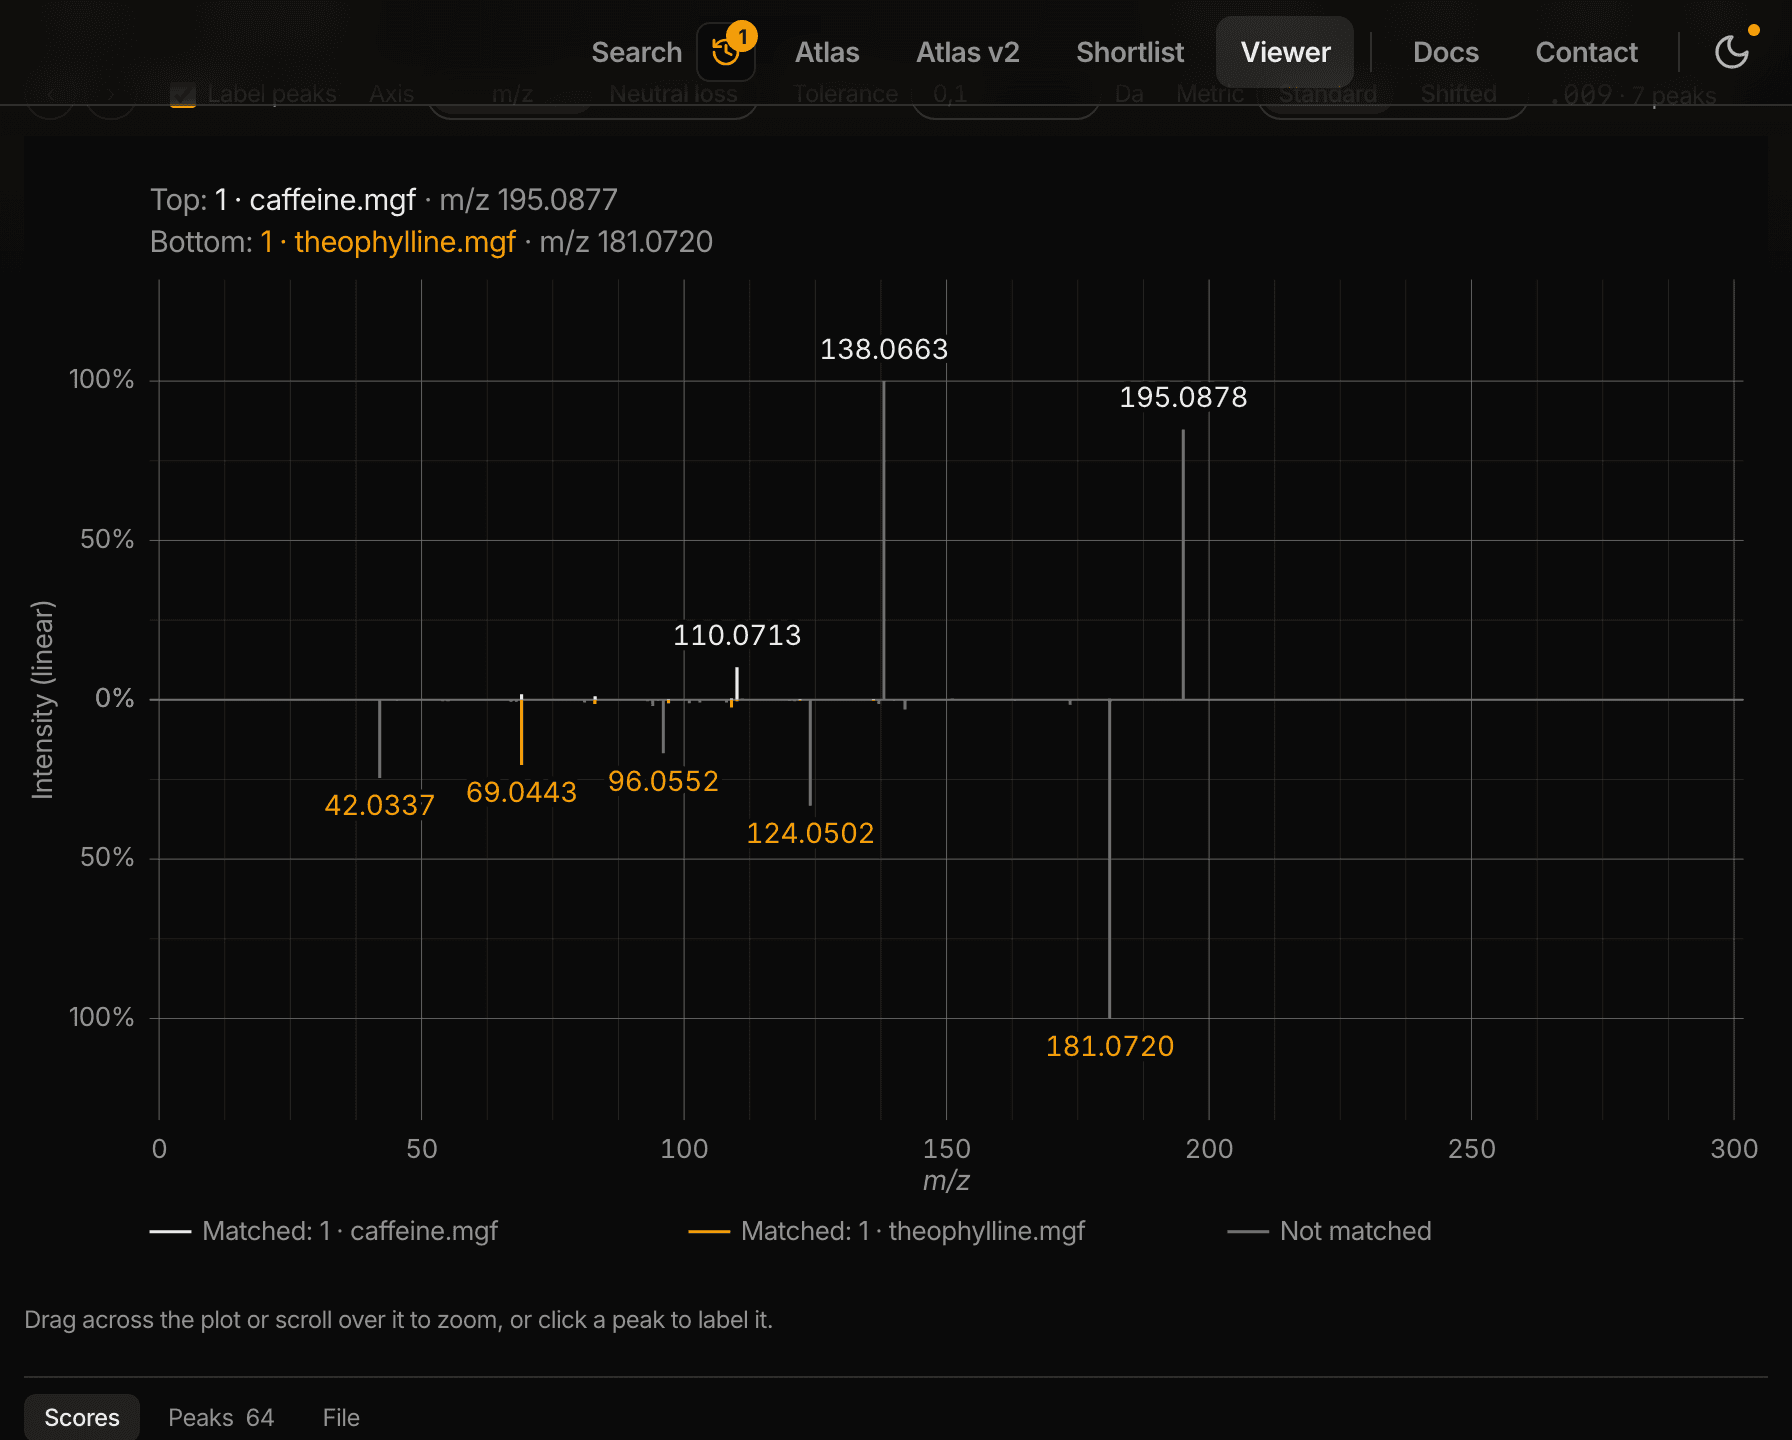
The two spectra can come from one file or from two, which makes this the quickest way to check a replicate against a standard.
DreaMS Atlas
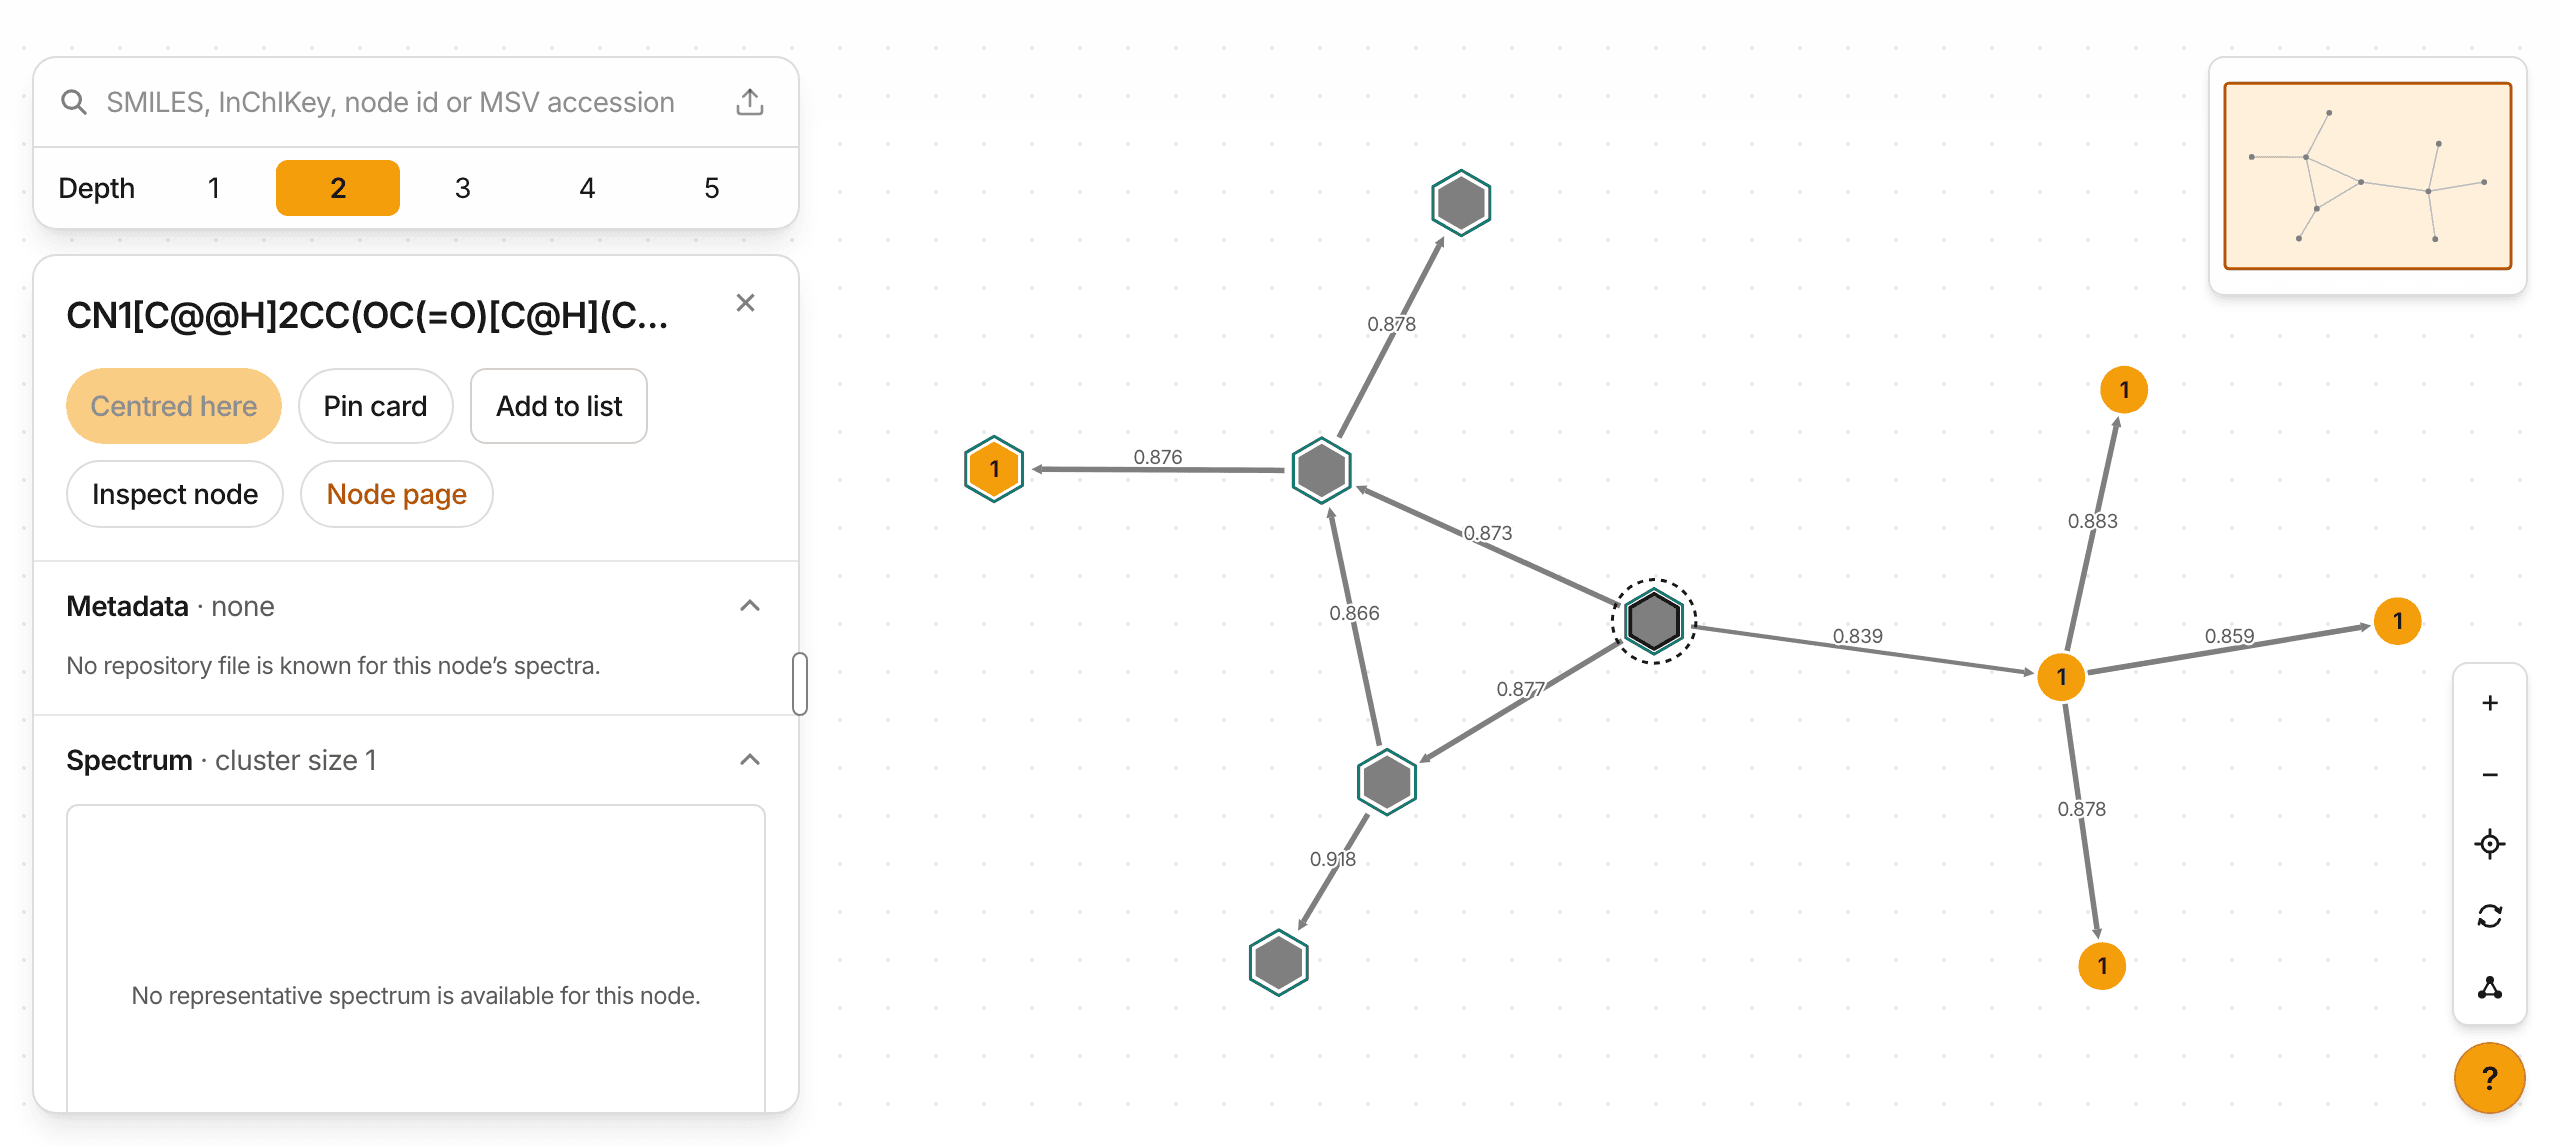
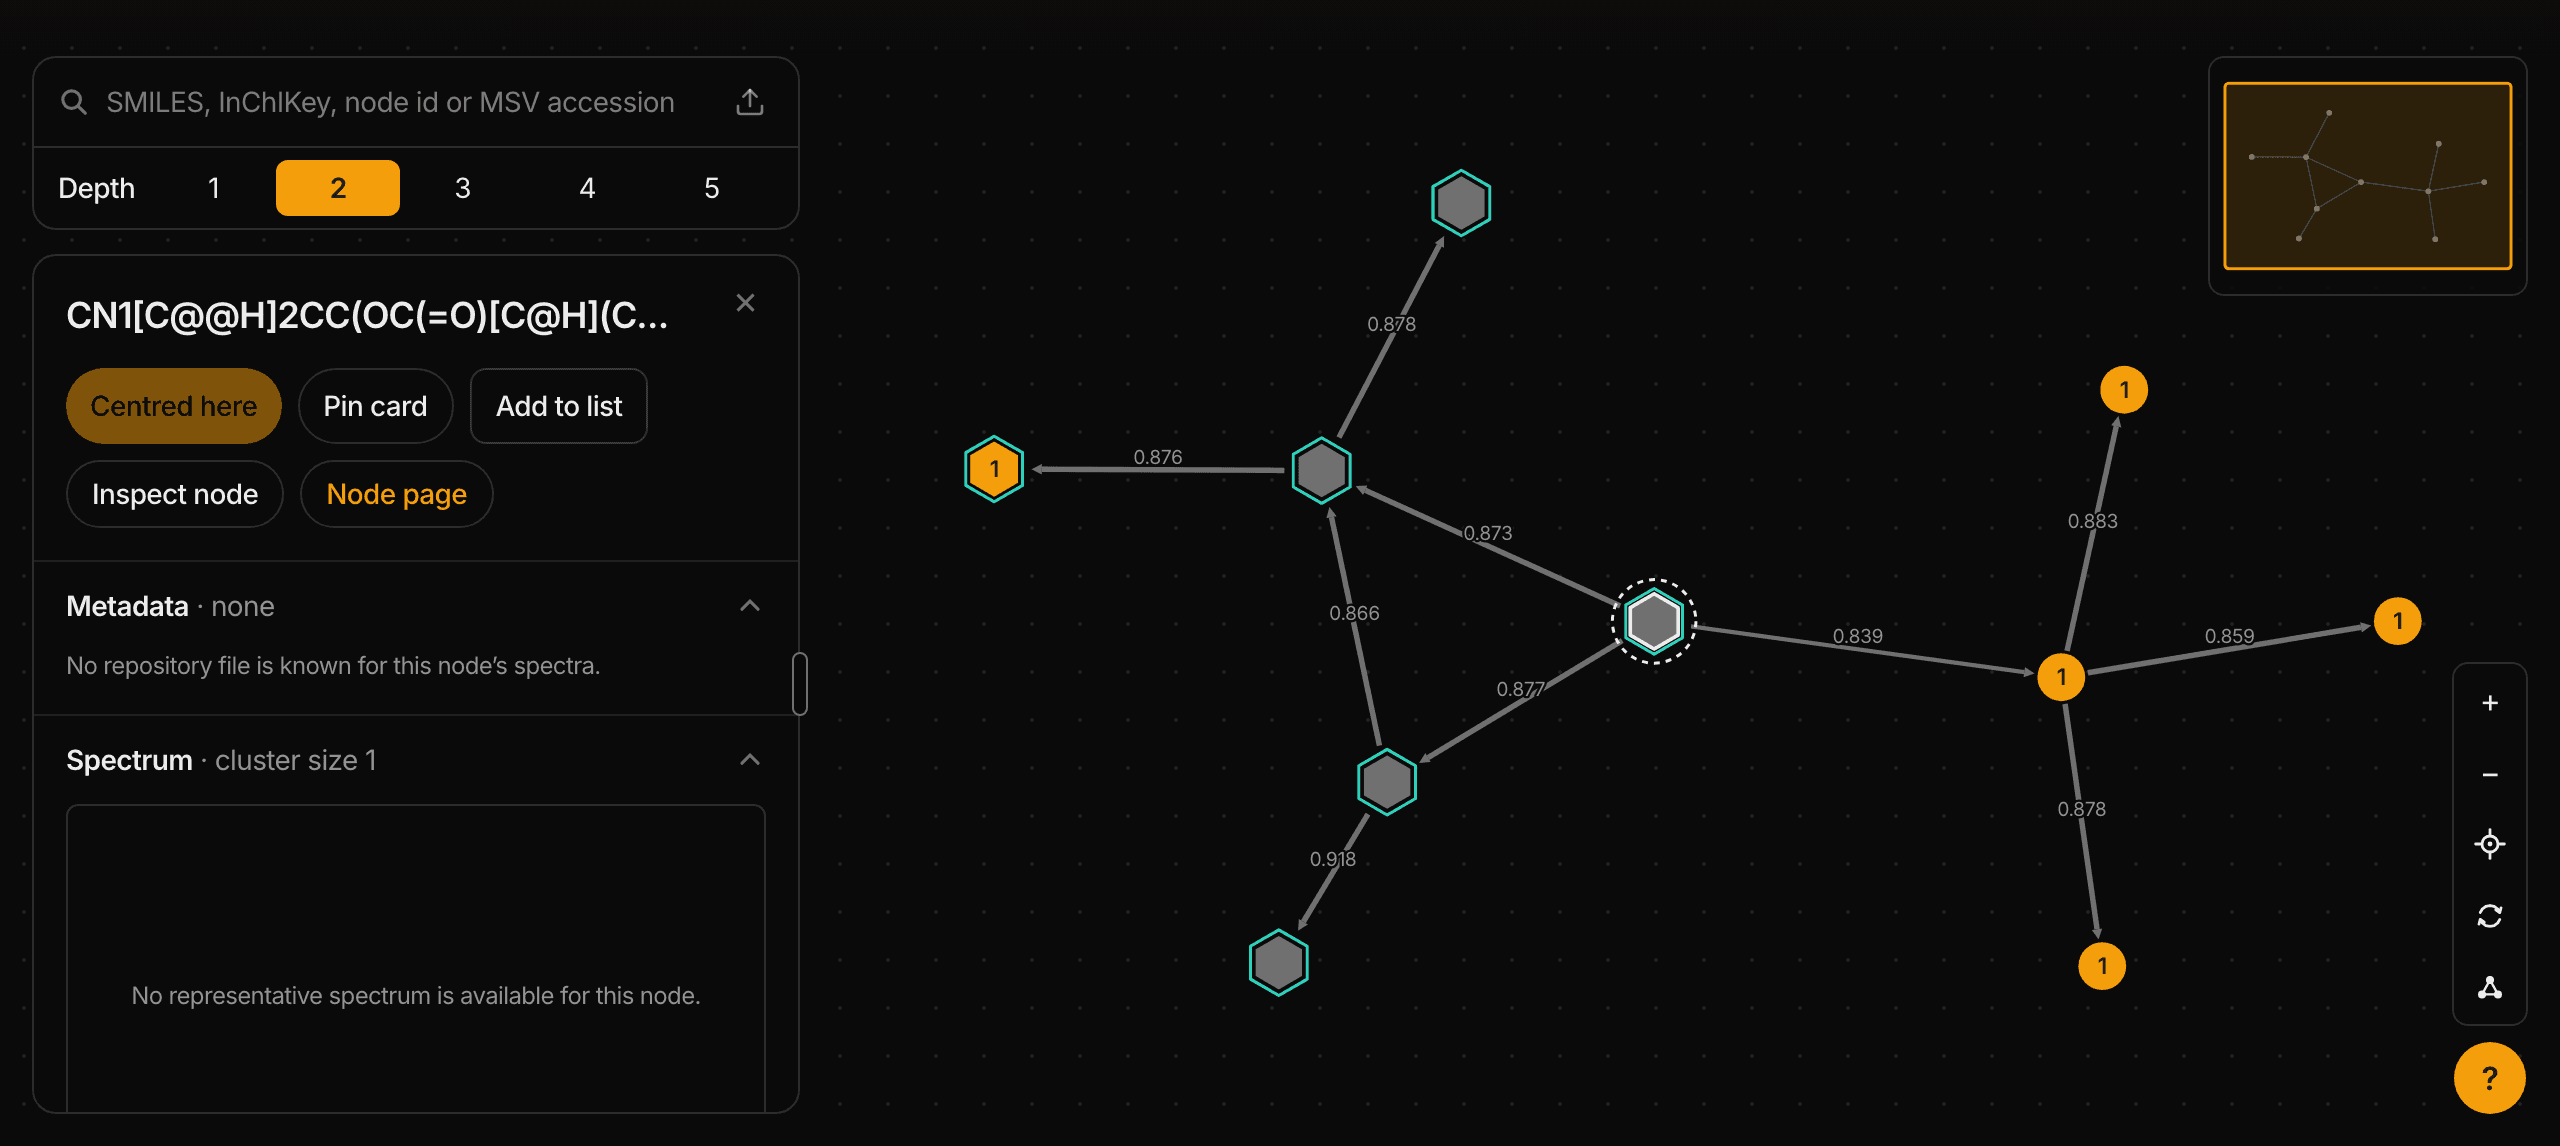
The Atlas groups similar spectra into A group of MS/MS spectra with similar fragmentation patterns. Its members can differ in ion or molecule, so sharing a cluster does not show that every spectrum is the same molecule. and connects related spectral clusters using DreaMS similarity. A spectrum is one fragmentation measurement: its peaks record the fragments produced when a precursor ion was broken apart. A spectral cluster contains a collection of these measurements. They may come from more than one molecule. Each view names the Atlas release or download it describes.
Browsing the graph
Select a spectral cluster to open its summary while the graph stays centered where it is. Choose Explore neighborhood to move the center deliberately, or Add neighbors to add nearby spectral clusters to the current view. Panning and zooming change the camera. Source summaries still include the full set of loaded spectral clusters. A graph link describes spectral similarity. A chemical reaction or shared biological activity needs separate evidence.
Use the connected views to move between a question and its evidence. The available records depend on the Atlas release or download. Establishing that a molecule is absent requires independent evidence.
- Spectrum
- Read one stored measurement and compare it with another available spectrum.
- Spectral cluster
- Browse its member spectra, reference annotations and recorded source evidence.
- Neighborhood
- Explore the loaded spectral clusters and links, and summarize sources across that stated set.
- Molecule
- Find matching stored structure records, grouped by their different Atlas locations.
- Dataset
- Browse the dataset's stored member spectra. Nearby spectral clusters may contain records from other datasets.
- Shortlist
- Save interesting objects into named groups, add your own labels and notes, and decide later what to test.
Reading the graph
- Amber: sample metadata is recorded
- At least one of its spectra has a sample record saying what it was measured in, from ReDU or a MASST table.
- Grey: no linked sample metadata shown
- No sample metadata is shown for this spectral cluster. The source may not provide it, or its availability may be unknown.
- An outlined hexagon: a reference annotation
- From the annotated library, so it can be drawn. The hexagon also marks a NIST20 structure, which is not shown because that commercial library's license does not allow republishing it. You can still explore its neighbors.
- The number: the spectral cluster's C spectra
- The number shows how many GeMS C spectra fall into this spectral cluster. Where the Atlas has no count yet, it shows the cluster size instead. A spectral cluster with neither shows no number.
- A ring: where the walk is rooted
- The spectral cluster this neighborhood was drawn around.
- A dotted ring: the spectrum the panel is open on
- It stays while you point at another spectral cluster. A faint grey disc marks the one under the pointer. Neither is the root's ring.
- Thicker, shorter: more similar
- Width and length carry it at once, so neither has to be seen alone. Width follows similarity on one fixed scale, from 0.70 for the thinnest to 1.00 for the thickest. A link draws the same in every view.
- A diamond and a dashed line: one of your spectra
- A spectrum you placed from your own file, joined to its nearest Atlas spectral clusters. Each dashed line is labeled with its DreaMS similarity. Your spectra stay on this device and are never part of a shared link.
Frequently asked questions
- My search returned no hits. What now?
- Check three things. The quality filter may have dropped every spectrum, which fails the search with a stated reason. A filter in the results table may hide rows, since a hit missing the filtered value is left out. A library may be unavailable, and the page names it.
- Why are some score cells blank?
- A blank means the data was missing. A library without reference peaks leaves every peak-based score blank. A missing precursor m/z leaves the precursor-loss cosine blank. A zero means the score was computed and came out at zero. For the other scores, read Reading results.
- Can I search negative-mode spectra?
- Yes. The model was trained on positive-mode spectra, so it works best there. The results state how many spectra were negative-mode and mark each one, so you can weigh those rankings.
- Why does the list show only some of my spectra?
- The list names the query spectra that produced hits, and the line under it says how many that was. The CSV file holds every hit for every query spectrum.
- My upload was rejected. What do I check?
- Check the file extension first, since it decides whether an upload is accepted. If the file is too large or holds too many spectra, the search form says which limit it exceeded. All limits are listed in What your file needs.
- Can I close the tab while a search runs?
- Yes. The search keeps running on the server, and Recent searches lists it again in the same browser.
- How long are results kept?
- The server keeps a finished search and its download for a limited time. The limit is listed in What your file needs. Download the CSV file to keep a copy.
Glossary
- Adduct
- The ion form a molecule takes in the instrument, such as [M+H]+, the molecule plus one proton.
- Analog
- A related compound with a similar structure. A search returns analogs when your exact molecule is missing from the library.
- Annotated
- A library or hit that carries a molecular structure, so the hit can name its compound.
- Centroided
- A spectrum stored as one m/z value and one intensity per peak. Profile mode stores the full peak shape instead.
- CSV file
- A table of every hit for every query spectrum, which you download from the results.
- Custom library
- Reference spectra you attach to one search. The server holds them in memory for that search only.
- Dataset
- A collection of spectra measured in public repository datasets. Its spectra carry no structure, so a hit points to a similar measurement and gives no name.
- Embedding
- The list of numbers the DreaMS model computes from one spectrum. Similar spectra get similar lists.
- Fragment
- A piece of the precursor ion, produced when it breaks apart. Each peak in an MS/MS spectrum is a fragment.
- Hit
- One reference spectrum the search ranks as similar to a query spectrum. A row of the results table shows one hit.
- Library
- A set of reference spectra, each linked to a molecular structure, so a hit can name its compound.
- Mirror plot
- Your query spectrum drawn upward and the hit's reference spectrum drawn downward on one m/z axis. Peaks that line up are fragments both spectra share.
- Modified cosine
- A cosine score that also pairs peaks shifted by the precursor m/z difference. It holds up across related compounds.
- Precursor
- The intact ion selected for fragmentation. Its mass-to-charge ratio (m/z) is the precursor m/z.
- Precursor-loss cosine
- A cosine score over how far each peak sits below its precursor. It needs a precursor m/z on both spectra.
- Query spectrum
- One spectrum from the file you upload. The search ranks hits for each query spectrum on its own.
- Reference spectrum
- A spectrum stored in a library or dataset. Each hit is one reference spectrum.
- Tolerance
- How far apart two peaks may sit in m/z and still count as the same peak.
Further reading
- DreaMS model documentationThe model, its Python package, and tutorials on computing embeddings in your own code.
- Bushuiev et al., Nature Biotechnology 2025How the model was trained and evaluated, and the quality criterion the form offers.
- DreaMS source repositoryModel code and released checkpoints.
Cite the DreaMS paper if DreaMS Search supports your work: Bushuiev et al., Nature Biotechnology 2025.
Write to dreams@fi.muni.cz with a question, a result that looks wrong, or a library you would like served.